Chapters
- Risk/Leverage Ratios
- Profitability Ratios
- Valuation Ratios
- Activity Ratios
- Liquidity Ratios
- Understanding Financial Ratios
- Understanding Cash Flow Statements
- Understanding Income Statements
- Understanding Balance Sheet
- Understanding Financial Statements
- Basic Terms In Fundamental Analysis
- Steps In Fundamental Analysis
- Introduction
- Study
- Slides
- Videos
9. Liquidity Ratio
-
This ratio provide information about the company's ability to meet short-term financial obligations. This is done by comparing a company's most liquid assets (or, those that can be easily converted to cash) and its short term liabilities. In general, the greater the coverage of liquid assets to short-term liabilities, the better it is, since it is a clear signal that a company can pay debts that are going to become due in the near future and it can still fund its on-going operations. On the other hand, a company with a low coverage rate should raise a red flag for the investors as it may be a sign that the company will have difficulty meeting running its operations, as well as meeting its debt obligations. The biggest difference between each ratio is the type of assets used in the calculation. While each ratio includes current assets, the more conservative ratios will exclude some current assets as they aren't as easily converted to cash.
Regardless of the quality of the product or service provided, or the long-term potential for the company, if it does not have the resources to make payments on the outstanding debts in the short term, the company's ability to continue functioning (and avoid bankruptcy) is jeopardized.
9.1 Current Ratio
The current ratio is a popular financial ratio used to test a company's liquidity (also referred to as its current or working capital position) by deriving the proportion of current assets available to cover current liabilities. The concept behind this ratio is to ascertain whether a company's short-term assets (cash, cash equivalents, marketable securities, receivables and inventory) are readily available to pay off its short-term liabilities. In theory, the higher the current ratio, the better.
Current Ratio= Current Assets/Current Liabilities
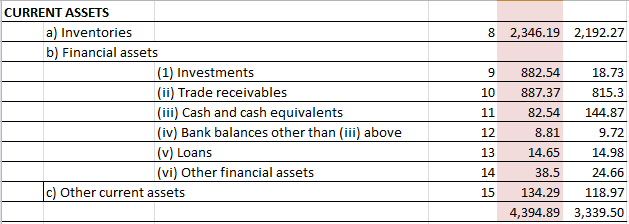
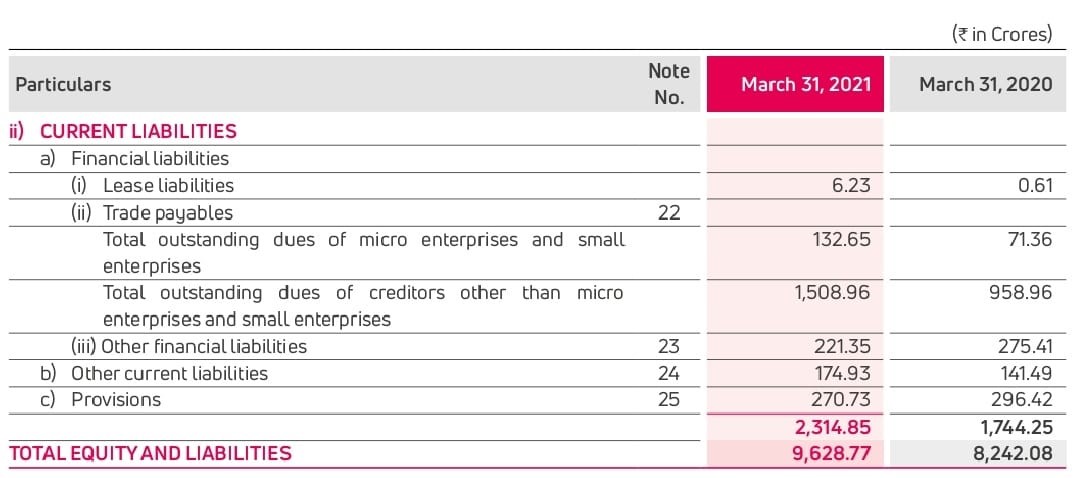
Lets take example of Exide Industries to understand the calculation of current Ratio:


Total current Assets of Exide industries (as can be seen above) as on 31st March 2021 is 4395crs and total current liabilities is Rs.2315crs.
Current Ratio= Current Assets/Current Liabilities
= 4395/2315= 1.89x
The 'x' in the above number represents a multiple. Hence 1.89x should be read as 1.209 'times'. This essentially means that for every one rupee of current liability that Exide industries has it has current assets to the extend of 1.89x to repay the same.
9.2 Quick Ratios
Quick Ratio
-
A slightly more demanding measurement of liquidity is the quick ratio (also called the acid test ratio), which removes inventories from current assets. Not all companies can easily convert inventories to cash, making the current ratio an overstatement of their actual liquidity position. Thus, The quick ratio measures a company's capacity to pay its current liabilities without needing to sell its inventory or obtain additional financing. It is considered a more conservative measure than the current ratio, which includes all current assets as coverage for current liabilities. The higher the ratio result, the better a company's liquidity and financial health; the lower the ratio, the more likely the company will struggle with paying debts.
Why Is It Called The "Quick" Ratio?
The quick ratio looks at only the most liquid assets that a company has available to service short-term debts and obligations. Liquid assets are those that can quickly and easily be converted into cash in order to pay those bills.
What Assets Are Considered The Most "Quick"?
The quickest or most liquid assets available to a company are cash and cash equivalents (such as money market investments), followed by marketable securities that can be sold in the market at a moment's notice through the firm's broker. Accounts receivable are also included, as these are the payments that are owed in the short run to the company from goods sold or services rendered that are due.
What Happens If The Quick Ratio Indicates A Firm Is Not Liquid?
In this case, a liquidity crisis can arise even at healthy companies - if circumstances arise that make it difficult to meet short-term obligations such as repaying their loans and paying their employees or suppliers. One example of a far-reaching liquidity crisis from recent history is the global credit crunch of 2007-08, where many companies found themselves unable to secure short-term financing to pay their immediate obligations. If new financing cannot be found, the company may be forced to liquidate assets in a fire sale or seek bankruptcy protection.
Calculation of Quick Ratio
Quick Ratio = Cash & Equivalents+ short-term investments+ accounts receivables/ Current Liabilities
In the above example of Exide Industries:

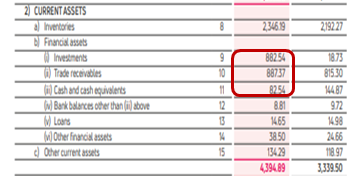
Quick Assets (Investments+ trade receivables+ cash & cash equivalents + Bank balance) = 882.54+887.37+82.54+8.81= 1861.26
Current Liabilities = 2315
So Quick Ratio= 1861.26/2315= 0.80x
9.3 Cash Ratios
Cash Ratio
The most conservative measurement of solvency is the cash ratio. This ratio is an indicator of a company's liquidity that further refines both the current ratio and the quick ratio by measuring the amount of cash; cash equivalents or invested funds there are in current assets to cover current liabilities
Cash Ratio= Cash+ Cash Equivalents+ Invested Funds / Current Liabilities
To calculate cash ratio in the above example, you will just take- investment+ Cash & Cash equivalent+ bank balance to calculate the cash available,
Cash Available = 882.54+82.54+8.81=973.89
Current liabilities= 2315
So, Cash Ratio= 973.89/2315= 0.42x
If the firm's cash ratio is greater than one, there is little solvency risk since all pending liabilities can be covered by existing liquid assets. While in a difficult economic environment a high cash ratio is a strong signal of financial strength, in a robust market this high level of cash may indicate that the firm is managing its finances excessively conservatively and missing opportunities for growth.

