- Study
- Slides
- Videos
4.1 What is NAV?
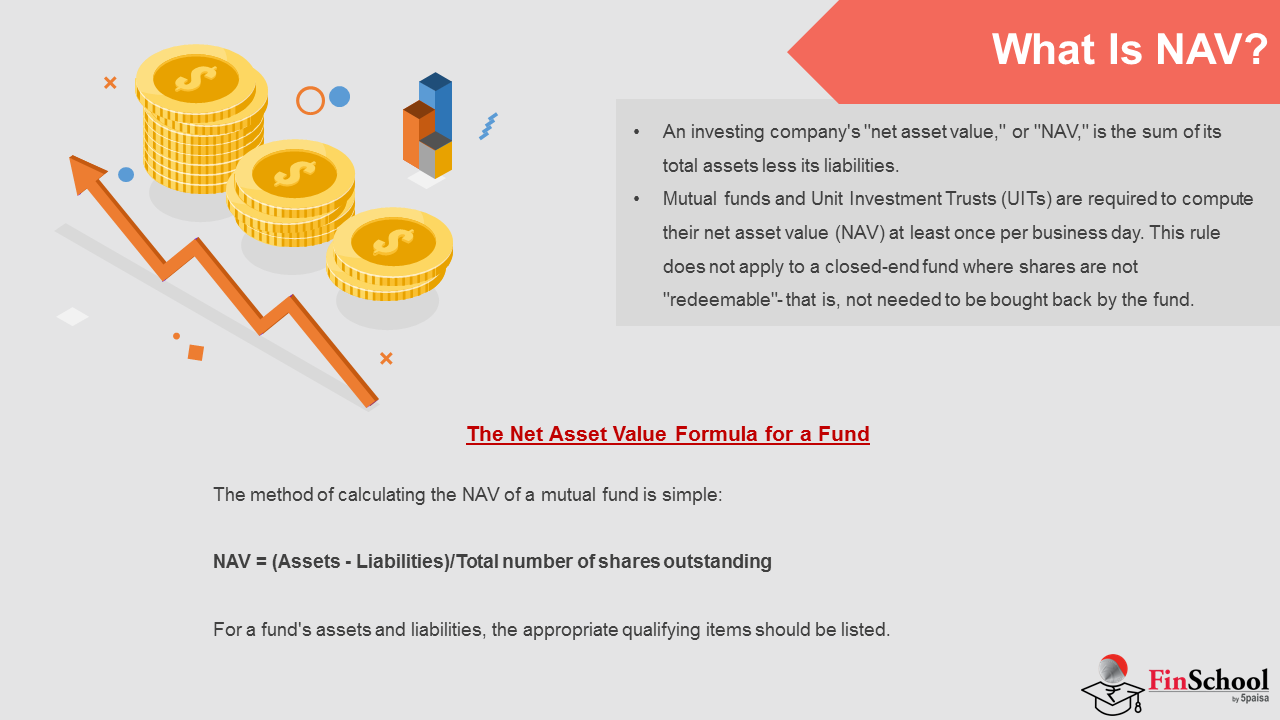
An investing company’s “net asset value,” or “NAV,” is the sum of its total assets less its liabilities. For example, if an investment business has Rs.100 in securities and other assets and Rs.10 in liabilities, its net asset value (NAV) is Rs90. Since an investment company’s assets and liabilities fluctuate on a regular basis, the NAV will fluctuate as well. The net asset value (NAV) may be Rs90 one day, Rs.100 the next, and Rs.80 million the next.
Mutual funds and Unit Investment Trusts (UITs) are required to compute their net asset value (NAV) at least once per business day. This rule does not apply to a closed-end fund where shares are not “redeemable”- that is, not needed to be bought back by the fund.
The Net Asset Value Formula for a Fund
The method of calculating the NAV of a mutual fund is simple:
NAV =(Assets – Liabilities)/Total number of shares outstanding
For a fund’s assets and liabilities, the appropriate qualifying items should be listed.
What are net assets of a mutual fund and how are they valued:
The net assets of a mutual fund include all the resources that have been invested into the stocks of the mutual fund scheme.
What is a Net Asset Value (NAV)?
The Net Assets of a mutual fund are calculated as given ahead:

Given below are some common examples of net assets and their valuation rules –
- Listed and traded securities should be valued on the closing market value.
- Illiquid shares and debentures should be valued at the lower of either the book value or the last available price.
- Listed/Traded debentures and bonds should be valued at the lower of either the closing traded value or the yield value.
- Fixed income securities should be valued at their current yield.
How Frequently is the NAV Calculated?
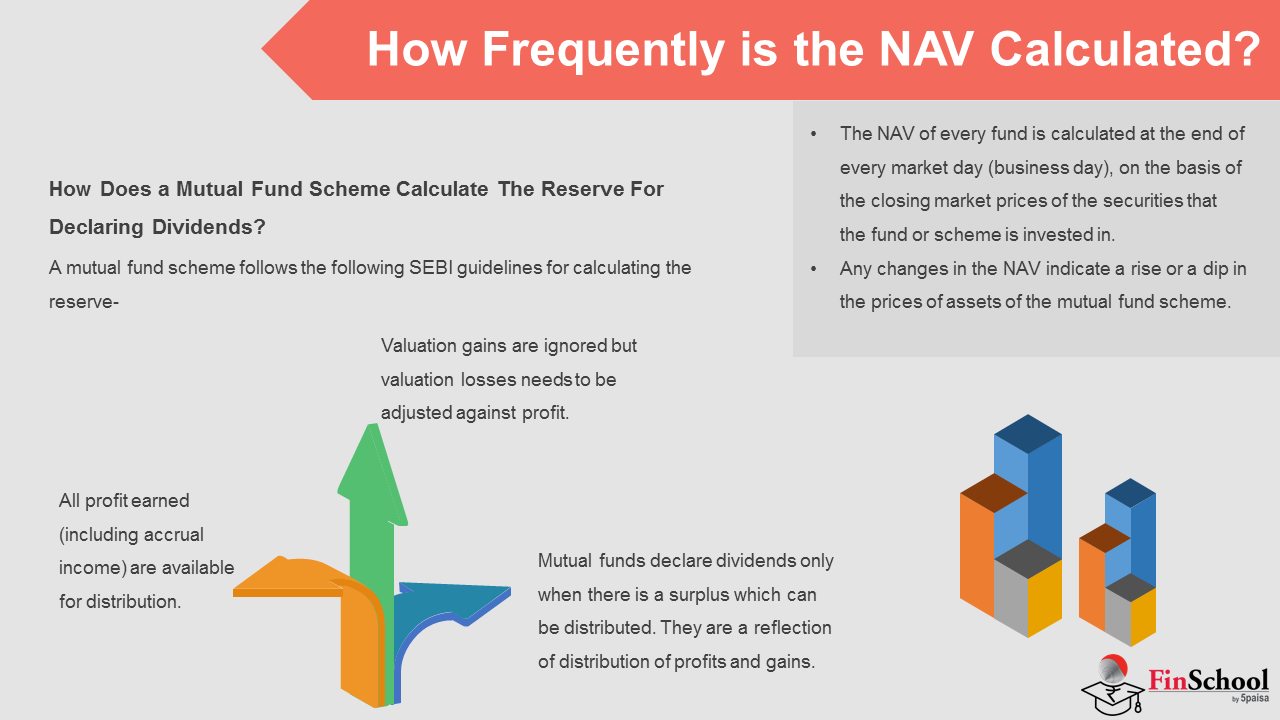
The NAV of every fund is calculated at the end of every market day (business day), on the basis of the closing market prices of the securities that the fund or scheme is invested in.
Any changes in the NAV indicate a rise or a dip in the prices of assets of the mutual fund scheme.
How Does a Mutual Fund Scheme Calculate The Reserve For Declaring Dividends?
A mutual fund scheme follows the following SEBI guidelines for calculating the reserve-
- All profit earned (including accrual income) are available for distribution.
- Valuation gains are ignored but valuation losses needs to be adjusted against profit.
- Mutual funds declare dividends only when there is a surplus which can be distributed. They are a reflection of distribution of profits and gains.
For example, suppose an investor buys a fund at a NAV of Rs 14.
Here, Rs 10 will go into capital account since the face value is Rs 10. The balance of Rs 4 will go as premium reserve. If the invested amount of Rs 14 grows up to Rs 17, then the fund can declare a dividend of Rs 3, which is the gain on the NAV of Rs 14.
The funds cannot use the unit premium reserve to pay its dividends.
What is MTM (Mark to Market) and Its Importance?
The process of valuing each security in the investment portfolio of the scheme at its market value is called “MARK TO MARKET” in mutual fund parlance.
This process is very important for mutual fund investors to understand for the following reasons –
- MTM helps in finding the asset values according to the market prices at the end of each day in order to arrive at the profit or loss status of the parties.
- MTM helps investor buy & sell units of a scheme at a true and fair price.
- Mark to market based NAV helps in assessing the performance of the scheme / Fund manager.
4.2 What Is Expense Ratio?
An expense ratio (ER), often known as a management expense ratio (MER), is a metric that determines how much of a fund’s assets are utilised for managerial and other operating costs. Divide a fund’s operational costs by the average value of its assets under administration to get an expense ratio (AUM). Operating expenses deplete the fund’s assets, lowering the fund’s return on investment.
Expense Ratio Components
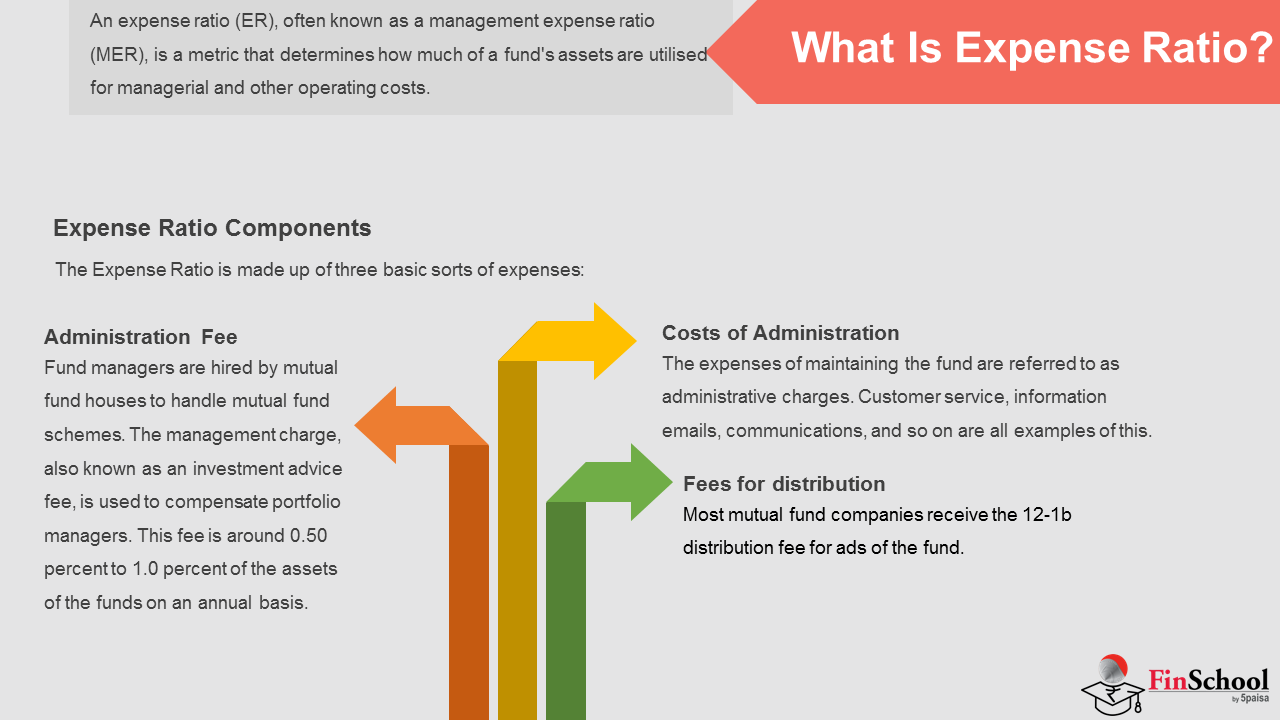
The Expense Ratio is made up of three basic sorts of expenses:
- Administration Fee
Fund managers are hired by mutual fund houses to handle mutual fund schemes. The management charge, also known as an investment advice fee, is used to compensate portfolio managers. This fee is around 0.50 percent to 1.0 percent of the assets of the funds on an annual basis.
- Costs of Administration
The expenses of maintaining the fund are referred to as administrative charges. Customer service, information emails, communications, and so on are all examples of this.
- Fees for distribution
Most mutual fund companies receive the 12-1b distribution fee for ads of the fund.
Calculation of Expense Ratio
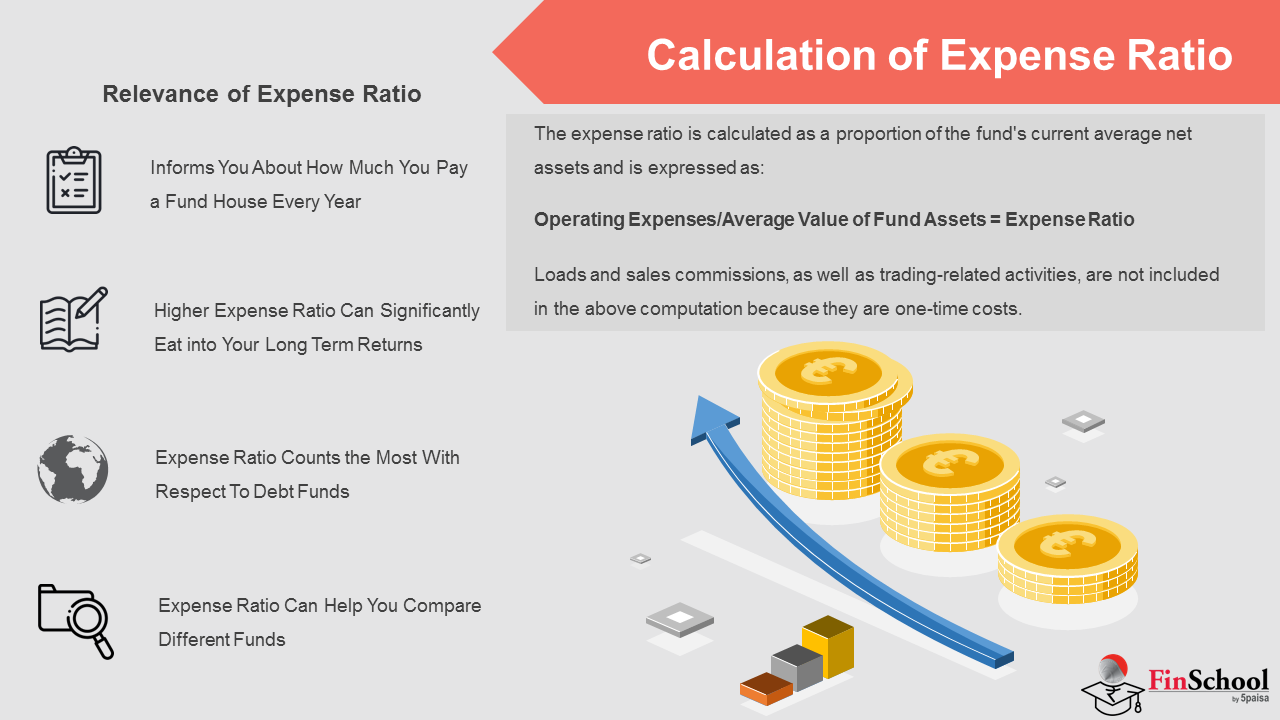
The expense ratio is calculated as a proportion of the fund’s current average net assets and is expressed as:
Operating Expenses/Average Value of Fund Assets = Expense Ratio
Loads and sales commissions, as well as trading-related activities, are not included in the above computation because they are one-time costs.
Relevance of Expense Ratio
1. Informs You About How Much You Pay a Fund House Every Year
The Expense Ratio tells you how much money you’ve shelled out in a year for your investment in the fund. Let’s say you’ve invested Rs. 1,00,000 in a fund that has an expense ratio of 1%. So ideally, the total money you’ve shelled out in a year on your investment as expense ratio is Rs. 1000. Actually, you’ll be shelling out more than Rs. 1000 because as the value of your investments goes up the expense ratio also moves in the same proportion. One other way to look at it is that, if the fund you invest in earns a return of 10% and the expense ratio is 1%, then you’ve earned a return of 9%. So keeping a check on the expense ratio tells you how much real return have you earned on your investment.
2. Higher Expense Ratio Can Significantly Eat into Your Long Term Returns
Since expense ratio is a fee that is charged to you till the time you’re invested in a fund, a higher expense ratio over the long term can bite into a significant chunk of your returns.
For instance, let’s say you invest 1 lakh in a fund with an expense ratio of 2%. The average annual return delivered by the fund is 10%. So ideally, due to compounding, by the end of 10 years, your investment value should have been Rs. 2.6 lakh. But, it will only be Rs. 2.15 lakh because of the 2% expense ratio that eats into your returns bringing it down to 8% rather than 10%. So it’s always important and recommended by experts to choose a fund that has a lower expense ratio. This helps you maximize your returns.
3. Expense Ratio Counts the Most With Respect To Debt Funds
Typically it is seen that average returns delivered by debt funds are around 6-9%. Sometimes, it can be higher or lower too. Now, if you choose a debt fund that has a higher expense ratio, say 1.5%, then your returns would come down to a mere 4.5-7.5%. So in order to protect your returns, you need to be extra cautious about expense ratio while choosing a debt fund as they have relatively lower yield than equity funds. Choosing a debt fund with the least expense ratio will help you maximize your returns.
4. Expense Ratio Can Help You Compare Different Funds
Expense Ratio can be treated as one of the parameters to compare two or multiple funds. For instance, if two funds have performed similarly in the past, it gets difficult for an investor to choose which fund should they go with. Here, looking at the expense ratio of the funds can help you. The fund with the lower expense ratio will suit you the best as it means more returns for you. However, the expense ratio shouldn’t be treated as a stand-alone criterion for choosing funds.
4.3 Portfolio Turnover
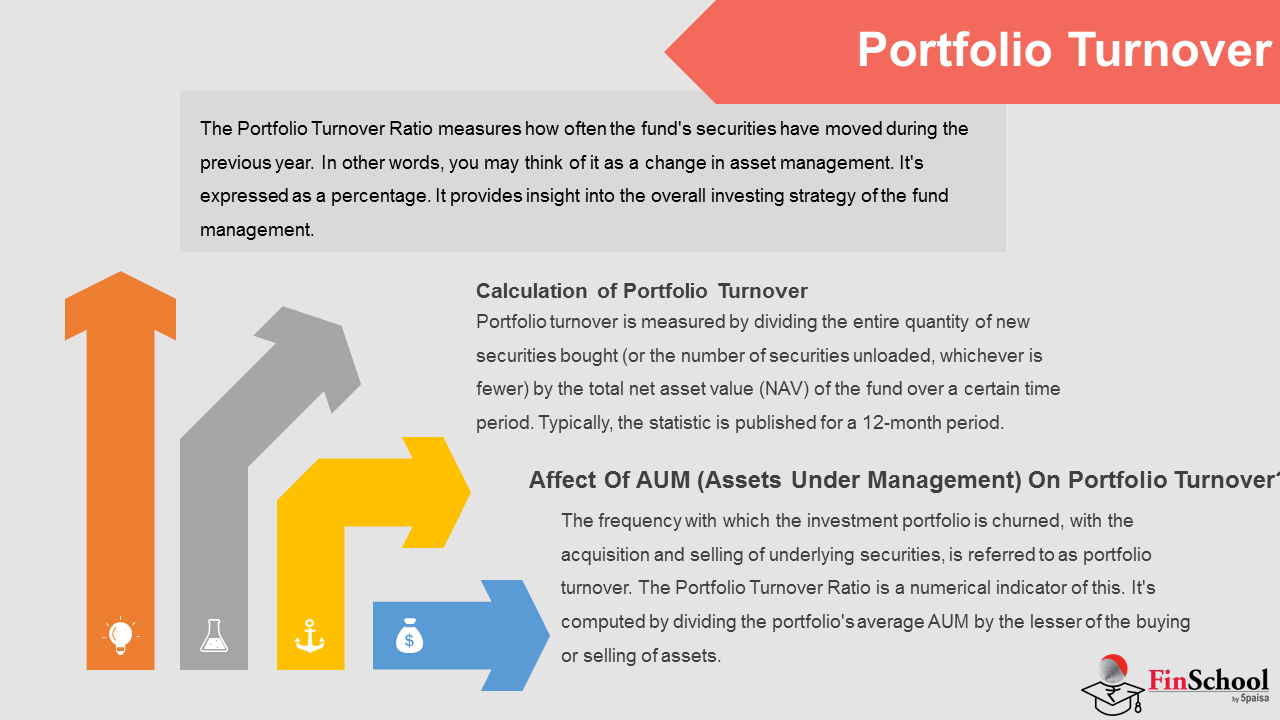
The Portfolio Turnover Ratio measures how often the fund’s securities have moved during the previous year. In other words, you may think of it as a change in asset management. It’s expressed as a percentage. PTR gives information on a variety of topics. It provides insight into the overall investing strategy of the fund management.
By looking at the PTR, you can gain a better understanding of how the fund works. It may be found in a mutual fund program’s monthly fact sheet. The Portfolio Turnover Ratio of a fund can, however, be calculated using a simple formula. It’s computed by multiplying the lesser of acquisitions and sales by the average total fund (AUM).
In other perspective, Before purchasing a mutual fund or other financial instrument, a buyer should think about the portfolio turnover metric. This is due to the fact that a fund with a high turnover will have high trading expenses than one with a lower rate. A less active trading posture may produce higher fund returns unless the decent cost selection offers advantages that cover the increased transaction costs.
Furthermore, cost-conscious fund investors should be aware that transactional brokers fees are not included in the computation of a fund’s operating expense ratio, and so represent a major additional expense that decreases payoff in high-turnover holdings.
Calculation of Portfolio Turnover
Portfolio turnover is measured by dividing the entire quantity of new securities bought (or the number of securities unloaded, whichever is fewer) by the total net asset value (NAV) of the fund over a certain time period. Typically, the statistic is published for a 12-month period.
Affect Of AUM On Portfolio Turnover?
AUM Meaning
Assets Under Management, or AUM, is the entire market value of the investments that an organisation manages on behalf of third parties. The capital raised from investors and the capital owned by the mutual fund firm’s principals are both included in the assets under management of a commercial bank.
Assets under management are strongly tied to the financial institution’s profitability. A better institution’s success would imply more cash holdings. When assessing assets under management, some banking institutions include bank deposits, mutual funds, and cash, while others only include funds under discretionary management, when the investor gives the company authorization to trade on his behalf.
These assets are managed by the relevant fund managers, who make investment choices on behalf of all investors. AUM stands for Assets Under Management, and it is used to measure the size and success of a fund institution.
How does AUM affect Portfolio Turnover
The frequency with which the investment portfolio is churned, with the acquisition and selling of underlying securities, is referred to as portfolio turnover. The Portfolio Turnover Ratio is a numerical indicator of this. It’s computed by dividing the portfolio’s average AUM by the lesser of the buying or selling of assets.
For example, if a fund sold Rs. 50 crore worth of equities assets and bought Rs. 70 crore worth of securities in a given year, and the fund’s annual AUM is Rs. 500 crore, the PTR would be 50/500, or 1 percent. This simply means that the property portfolio was churned by 1% during the course of the year.
4.4 Exit Loads
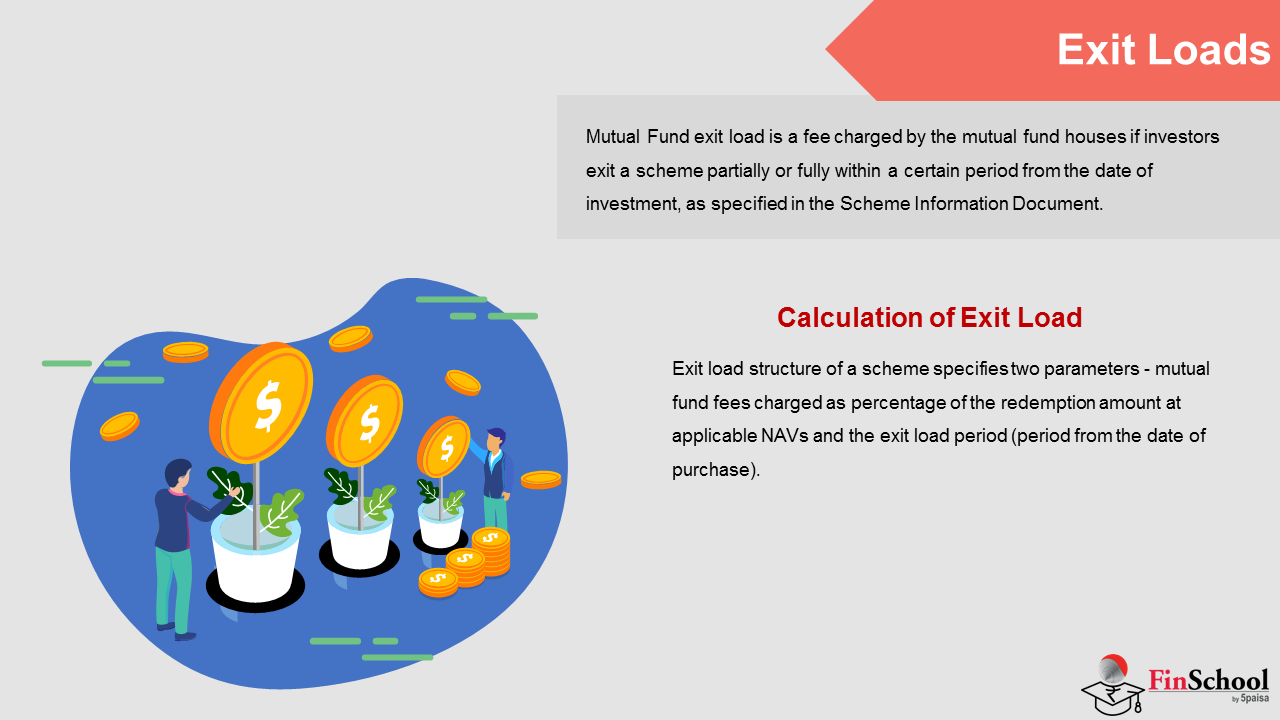
Mutual Fund exit load is a fee charged by the mutual fund houses if investors exit a scheme partially or fully within a certain period from the date of investment, as specified in the Scheme Information Document
It is charged as a percentage of the mutual fund’s Net Asset Value (NAV). The exit load is usually deducted from the total NAV and the leftover money is credited to the investment’s account by the AMC.
Mutual fund charges exit load to discourage investors from redeeming before a certain time period. This is done to protect the financial interest of all investors in the scheme, especially the ones who remain invested. Different mutual funds houses charge different fees for different schemes as an exit load. If you want to invest for short tenures then you should understand the exit load structure of the scheme so that you can make informed investment decisions.
Calculation of Exit Load
Exit load structure of a scheme specifies two parameters – mutual fund fees charged as percentage of the redemption amount at applicable NAVs and the exit load period (period from the date of purchase).
Suppose a scheme charges 1% exit load for redemptions within 365 days from the date of purchase. Suppose you redeem 500 units of a scheme 4 months after your date of purchase. Let us assume that the NAV is Rs 100. The exit load will be = 1% X 500 (number of units) X 100 (NAV) = Rs 500. This amount will be deducted from the redemption proceeds which gets credited to your bank account. So for this, the redemption amount received in your bank account will be Rs 49,500 (Units 500 X NAV Rs 100 – Rs 500 exit load = Rs 49,500.
Exit load calculation for SIP is slightly more complex because you purchase units at different price points. Suppose you start Rs 10,000 monthly SIP in a scheme on 1st July 2020. Let us assume that the scheme charges 1% exit load for redemptions within 365 days from the date of purchase. The units purchased in July will attract an exit load if redeemed before July 2021. The units purchased next month i.e. August will attract an exit load if redeemed before August 2021, so on so forth.
