- Study
- Slides
- Videos
5.1 How To Measure The Risk Involved In Mutual Fund
Investors often tend to look at investments only from the perspective of generating maximum returns for the money they are investing. Often, with this viewpoint, they hardly look at their own risk profile and the risk of the investment before making a decision. Almost all investments come with a degree of risk. If your return on these investments is not proportional to the risk associated with it, then it may not be fruitful to make these investments.
A good mutual fund is the one that gives better returns in its category, given the same risk.
While returns can be easily tracked, how does one determine or measure the risk associated with mutual funds?
Fortunately, there are ratios that already exist and calculate the risk and volatility of any mutual fund portfolio. This will not only give you a better understanding of risk and volatility, but also help you choose a better fund when you are looking at various mutual fund offer documents. Let us take a look at some key tools or ratios that measure this risk.
5.2 Alpha
Alpha
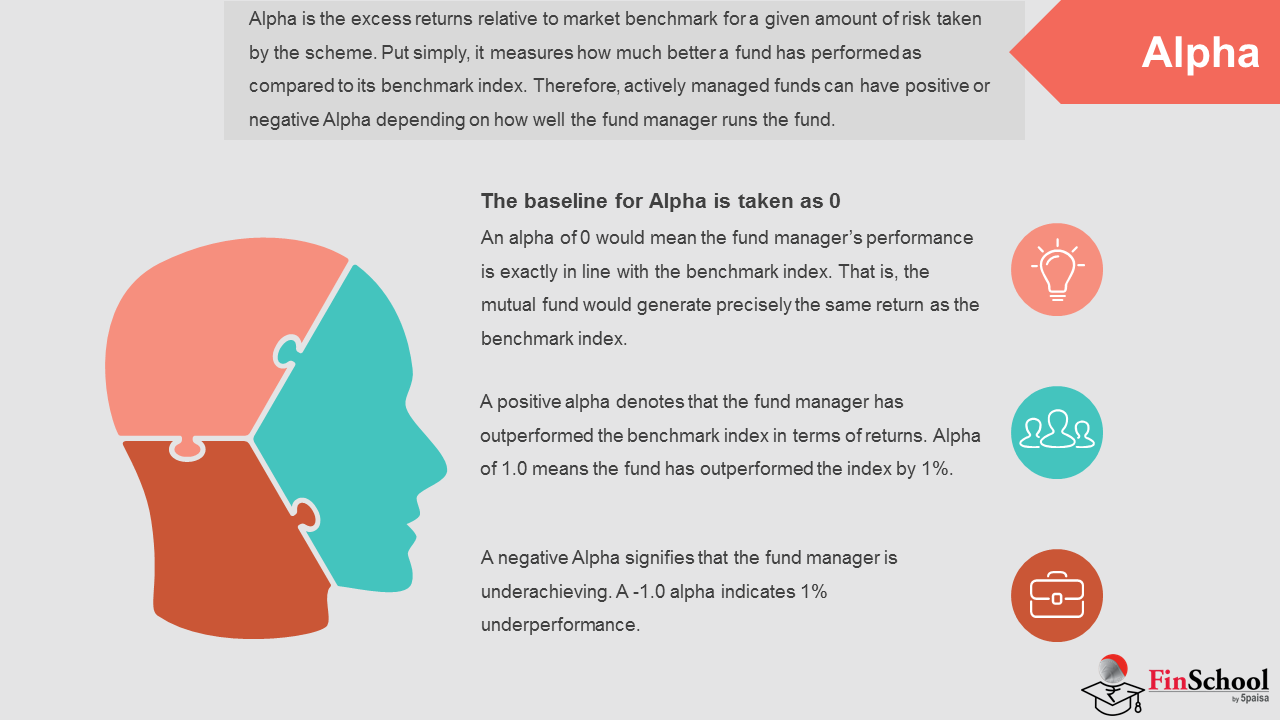
Alpha is the excess returns relative to market benchmark for a given amount of risk taken by the scheme. Put simply, it measures how much better a fund has performed as compared to its benchmark index. For instance, if the NIFTY 50 index delivered 10% in the past year and the fund benchmarked against the NIFTY 50 delivered 11%, then the Alpha is +1%. And if the fund underperformed and achieved only 8%, then the Alpha is -2%.
Therefore, actively managed funds can have positive or negative Alpha depending on how well the fund manager runs the fund. In fact, creating positive Alpha is the entire essence behind someone investing in an actively managed fund. Index Funds, on the other hand, will not produce any Alpha.
Note:The baseline for Alpha is taken as 0.
- An alpha of 0 would mean the fund manager's performance is exactly in line with the benchmark index. That is, the mutual fund would generate precisely the same return as the benchmark index.
- A positive alpha denotes that the fund manager has outperformed the benchmark index in terms of returns. Apha of 1.0 means the fund has outperformed the index by 1%.
- A negative Alpha signifies that the fund manager is underachieving. A -1.0 alpha indicates 1% underperformance.
For example- lets take comparison of Equity funds from value research whose benchmark index is Nifty 50.

It can be seen that axis bluechip has an alpha of 4.21 which means the fund has outperformed the index by 4.21% and at the same the number for canara robecco is 3.98 which shows that the fund has outperformed the benchmark by 3.98%.
5.3 BETA
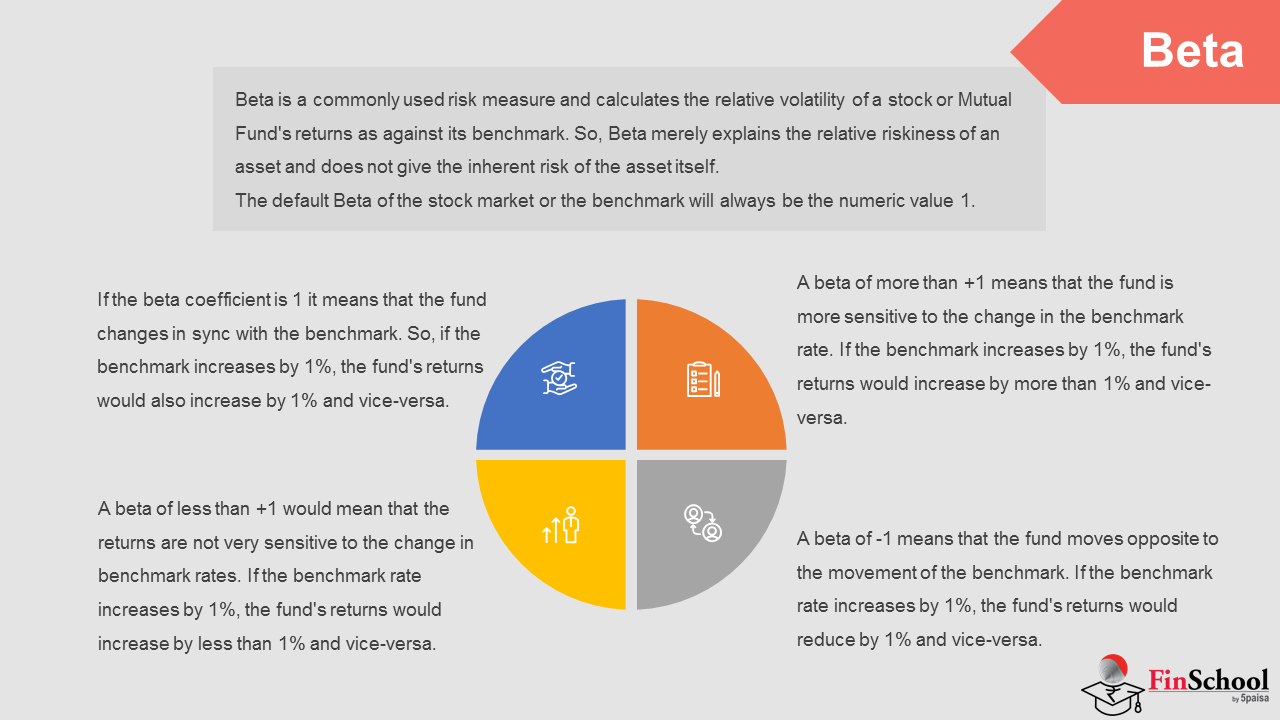
Beta is a commonly used risk measure and calculates the relative volatility of a stock or Mutual Fund's returns as against its benchmark. So, Beta merely explains the relative riskiness of an asset and does not give the inherent risk of the asset itself.
Beta is measured against a benchmark. In other words, the default Beta of the stock market or the benchmark will always be the numeric value 1. Since the Mutual Fund returns are measured against the benchmark, the value of Beta can be anything.
Here's how to read Beta:
- If the beta coefficient is 1 it means that the fund changes in sync with the benchmark. So, if the benchmark increases by 1%, the fund's returns would also increase by 1% and vice-versa.
- A beta of more than +1 means that the fund is more sensitive to the change in the benchmark rate. If the benchmark increases by 1%, the fund's returns would increase by more than 1% and vice-versa. A high beta indicates high volatility and the potential for high returns.
- A beta of less than +1 would mean that the returns are not very sensitive to the change in benchmark rates. If the benchmark rate increases by 1%, the fund's returns would increase by less than 1% and vice-versa.
- A beta of -1 means that the fund moves opposite to the movement of the benchmark. If the benchmark rate increases by 1%, the fund's returns would reduce by 1% and vice-versa.
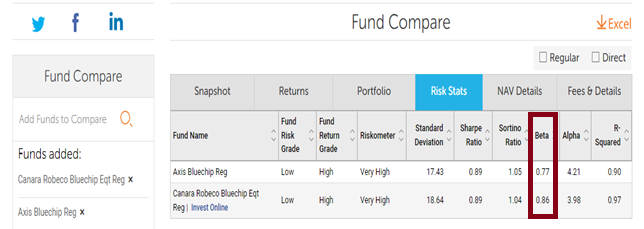
In the above example- we have highlighted the beta of the fund, which is 0.77 for Axis Blue chip & 0.86 for Canara Robeco. Like mentioned earlier, beta gives us a measure of the relative risk of the fund.
As discussed, If the beta of a mutual fund is less than 1, then the fund is perceived as less risky compared to its benchmark. For example, both axis and canara robeco fund has a beta of less than 1, however Axis Bluechip is less risky than Canara Robeco fund. This is because Canara Robeco is very close to 1. This implies, if its benchmark falls by 1%, then Canara Robeco is expected to fall by 0.86%.
And Axis blue chip is less risky or less volatile because if its benchmark falls by 1%, the fund is expected to fall by 0.77%.
This is what is meant by 'relative risk'; it gives us a perspective of how risky the fund is compared to its benchmark.
Now lets understand the concept of Alpha & Beta together and analyse the above numbers in sync

In case of above two funds- Axis blue chip fund has a higher alpha & a lower beta- which means that fund gives higher returns vs benchmark and at a reduced level of risk compared to Canara Robeco Bluechip fund. Thus between the two funds- one would prefer Axis blue chip fund
5.4 Standard Deviation
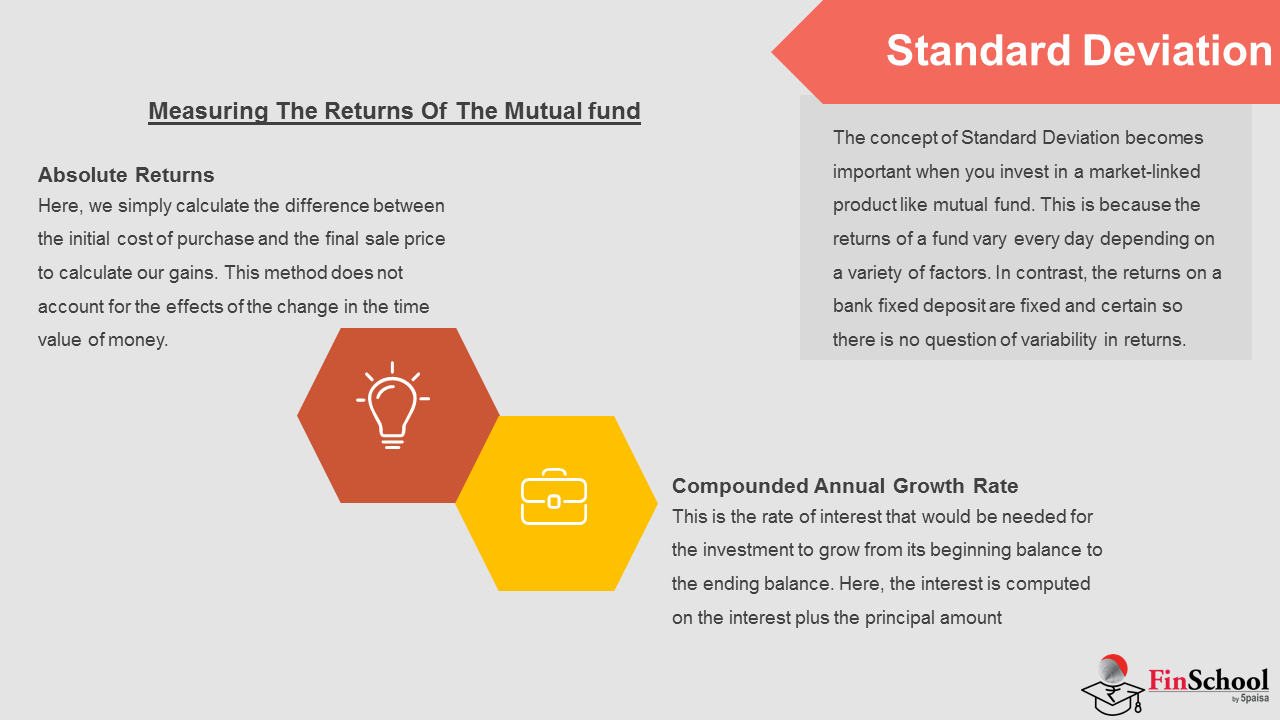
The concept of Standard Deviation becomes important when you invest in a market-linked product like mutual fund. This is because the returns of a fund vary every day depending on a variety of factors. In contrast, the returns on a bank fixed deposit are fixed and certain so there is no question of variability in returns.
Standard Deviation indicates the volatility of the fund's returns. Higher standard deviation means higher variation in returns and vice versa. In technical terms, it is a dispersion of returns from the average over a period of time. Generally, it is calculated using trailing monthly total returns for 3, 5 or 10 years.
Example, let's say a Mutual Fund delivers 10% average returns over a period of time. But as expected, this fund has had some good months and also some bad months with returns moving between +20% and -15%.
This up and down trajectory of returns in the Mutual Fund NAV is what standard deviation captures and presents as an annualized number.
For example: lets consider the above two funds:

The SD of the axis fund is 17.43% while the canara robeco fund is 18.64%, which implies that the canara fund is more riskier compared to the axis fund.
To put this context, if you invest Rs.10,000/- across funds at the same time, then by the end of the year the profit or loss can be anywhere in this range-

Loss = Investment * (1-SD)
Gains = Investment * (1+SD)
The larger the SD, the larger the possibility of loss or gains.
Measuring the Returns of the Mutual fund
The following methods are used to measure the returns of a mutual fund investment -
Absolute Returns
Here, we simply calculate the difference between the initial cost of purchase and the final sale price to calculate our gains.This method does not account for the effects of the change in the time value of money
Compounded Annual Growth Rate
This is the rate of interest that would be needed for the investment to grow from its beginning balance to the ending balance. Here, the interest is computed on the interest plus the principal amount
The formula for CAGR is as follows - CAGR= (Ending Balance/Beginning Balance)^(1/number of years).
For example, if the amount invested is Rs 10,000 and the value after 2 years is Rs 12,000, the CAGR is computed as (12,000/10,000)^(1/2) = 9.54%.
This method is a better way for calculating returns than calculating absolute returns because it takes into effect the change in the value of money overtime
5.5 Method To Evaluate The Performance Of Mutual Fund
Choosing investments is just the beginning of your work as an investor. As time goes by, you'll need to monitor the performance of these investments to see how they are working together in your portfolio to help you progress toward your goals. Generally speaking, progress means that your portfolio value is steadily increasing, even though one or more of your investments may have lost value. If your investments are not showing any gains or your account value is slipping, you'll have to determine why, and decide on your next move. To assess how well your investments are doing, you'll need to consider several different ways of measuring your fund's performance.
So let's look at some of the most popular methods of evaluation for mutual funds:
5.6 Information Ratio
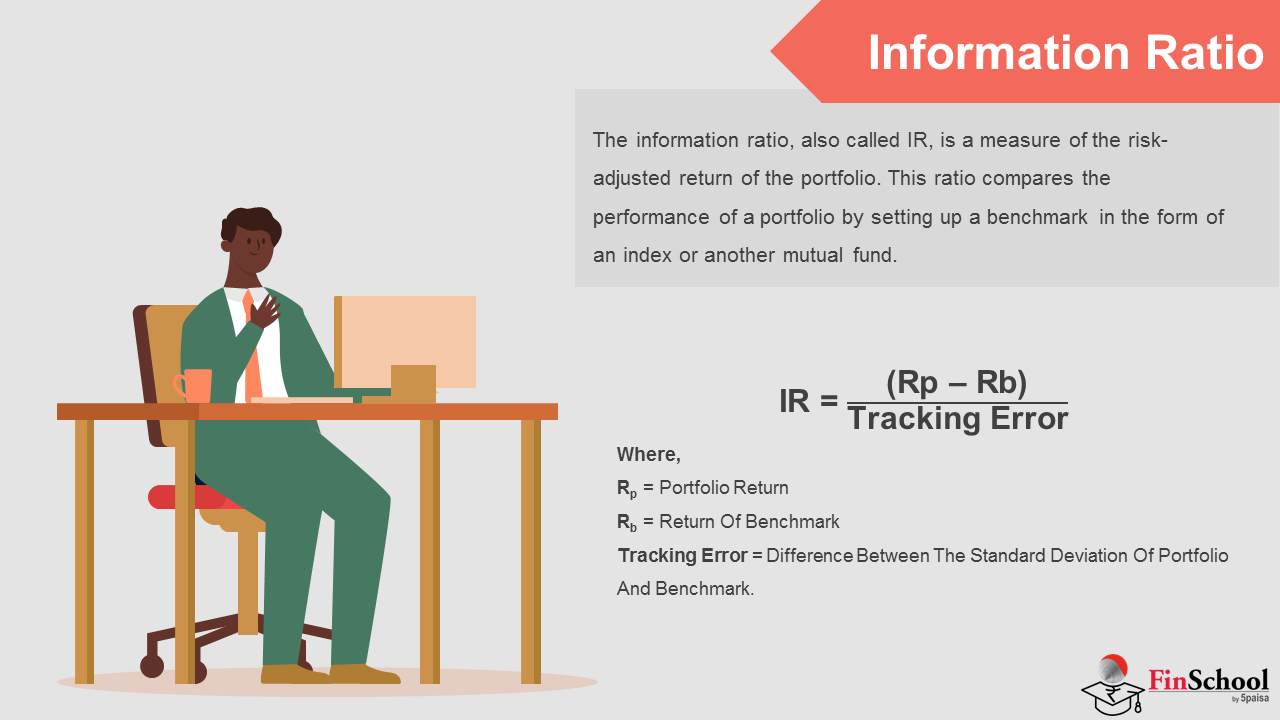
The information ratio, also called IR, is a measure of the risk-adjusted return of the portfolio. This ratio compares the performance of a portfolio by setting up a benchmark in the form of an index or another mutual fund.
This benchmark is usually a market index, like Nifty 50. It can also be an index representing any specific industry or market sector. Nevertheless, the Information ratio depicts how well a portfolio or asset is matching and exceeding an index's returns.
It is computed by dividing the active return of the fund divided by its tracking error. Active return is the difference between the fund's return and that of its benchmark index, and tracking error is the standard deviation of the active return. IR measures the fund's performance relative to its benchmark and adjusts it for the volatility in the dispersion between the two. It is also known as appraisal ratio.
IR = Rp - Rb/ Tracking error, where
Rp = portfolio return
Rb = return of benchmark
Tracking error = difference between the standard deviation of portfolio and benchmark.
Significance:
Essentially, the information ratio tells an investor how much excess return is generated from the amount of excess risk taken relative to the benchmark. This ratio test the consistency of a fund manager as it determines whether a manager has beaten the benchmark by a large margin in a few months or by small margins every month.
For a given level of risk taken, a higher active return will lead to a higher information ratio which indicates the consistency of a manager in delivering superior returns. The higher the information ratio, the better is the performance of the fund manager. Information ratio is extremely useful in comparing a group of funds with similar management styles.
Example of Information Ratio
For instance, you want to invest in a good fund and you are confused between two funds say Fund A and Fund B. Now, you want to compare the information ratio of these two funds to select the better option. Let us take Nifty 50 index as the benchmark.
Fund A has given 12% returns where the benchmark has given 10% returns and the standard deviation of the fund and benchmark returns is 6%. And, Fund B has given 12% Returns where the benchmark has given 8% returns and the standard deviation is 9%
Using the formula of Information ratio:
- Fund A-
IR= (12% - 10%)/6% = 0.33
- Fund B-
IR= (12% - 8%)/9% = 0.44
The Information ratio of Fund B is more than that of Fund A. This implies that Fund B is more consistent with the returns and has the potential to give better returns than Fund A.
Interpretation
If the information ratio of a mutual fund is negative, it indicates that the mutual fund manager was unable to produce any excess returns at all. An information ratio of less than 0.4 means that the mutual fund could not produce excess returns for a sufficiently long time and the fund may not be a good investment. If the information ratio is between 0.4 and 0.6, it is considered to be a good investment and an information ratio between 0.61 and 1 is considered as a great investment.
5.7 Sharpe Ratio
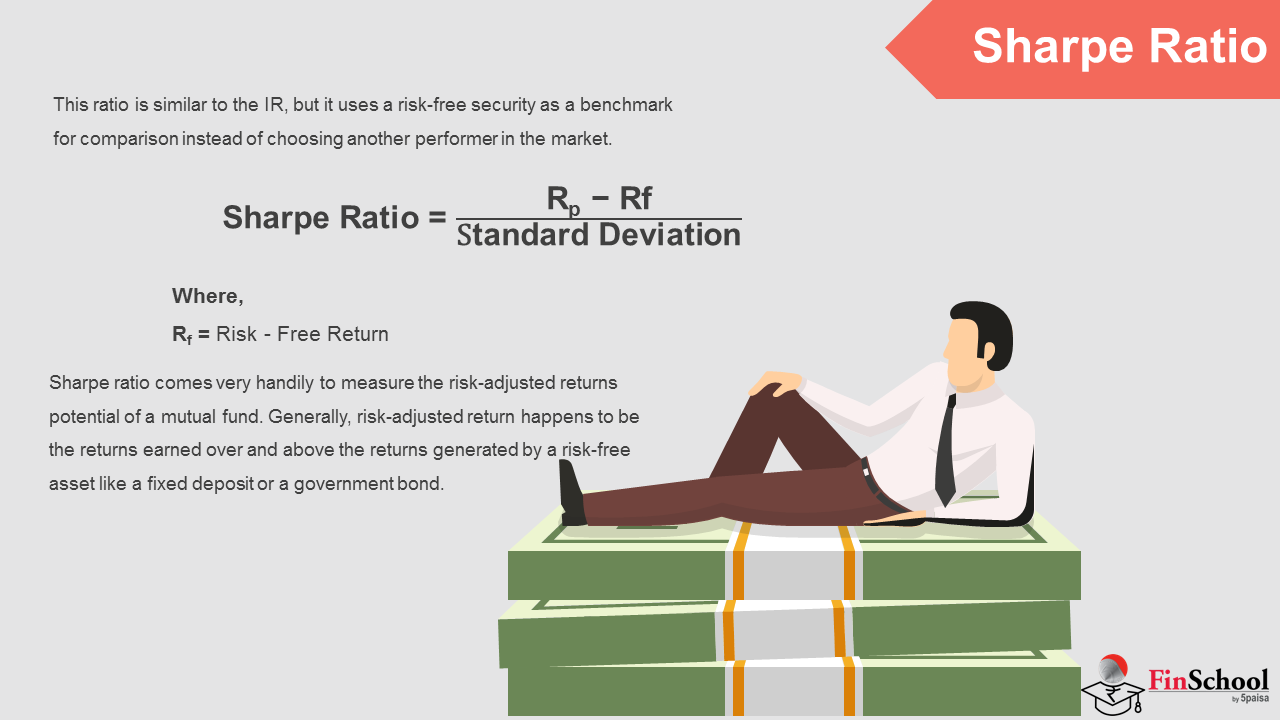
This ratio is similar to the IR, but it uses a riskfree security as a benchmark for comparison instead of choosing another performer in the market.
Sharpe Ratio = Rp - Rf / standard deviation,
where Rf = risk-free return
Sharpe ratio comes very handily to measure the risk-adjusted returns potential of a mutual fund. Generally, risk-adjusted return happens to be the returns earned over and above the returns generated by a risk-free asset like a fixed deposit or a government bond. The excessive returns are viewed in the light of the “extra risk” which an investor takes upon investing in a risky asset like equity funds.
The risk inherent in an investment is determined using the standard deviation. Thus, a higher Sharpe ratio indicates better return yielding capacity of a fund for every additional unit of risk taken by it. It becomes a justification for the underlying volatility of the fund. In fact, you may use the Sharpe ratio to compare the funds.
Analysis and Interpretation
A higher Sharpe metric is always better than a lower one because a higher ratio indicates that the portfolio is making better investment decisions and not being swayed by the risk associated with it. Here is a list of sharpe ratio grades and what they mean.
Sharpe Ratio Grading Thresholds
- <1: Not Good
- 1 - 1.99: Ok
- 2 - 2.99: Really Good
- >3: Exceptional
Take a portfolio that only invests in Treasure bills for example. These are considered risk-free investments, so there is no volatility and no earnings in excess of the risk-free rate. Thus, the Sharp Ratio would be zero for this portfolio.
Other portfolios with higher rates of risk might have a metric of 1, 2, or 3. Any metric equal to or greater than 3 is considered a great Sharpe measurement and a good investment all else equal.
A metric of 1, 2, or 3 tells us how much additional return one is getting for holding an risky investment over a risk-free investment. In a sense, it shows us the level of compensation we are receiving for the additional level of risk we are taking with the investment.
Example
Let's assume that you want to compare two different mutual funds in your portfolio with different risk levels. Obviously, the more risky of the two will tend to have higher returns, but which one has a higher return relative to the risk associated with the investment? Let's use the Sharpe ratio to see which one is performing better.
Investment #1
- Portfolio return: 20%
- Risk free rate: 10%
- Standard Deviation: 5
Investment #2
- Portfolio return: 30%
- Risk free rate: 10%
- Standard Deviation: 40
Sharpe Ratios
- Investment #1: 2
- Investment #2: .5
Sharpe Ratio Application
As you can see, investment #2 out performed investment #1 by a rate of 50 percent, but this doesn't mean that investment #2 performed well relative to its risk level. The sharpe ratio tells us that the first investment actually performed better than the second relative to the risk involved in the investment. If the second investment performed as well as the first investment relative to risk, it would have earned a return of 90 percent.
The second investment may have earned a higher return this year, but it has a higher risk and likelihood of volatility in the future.
Significance
Sharpe ratio indicates investors' desire to earn returns which are higher than those provided by risk-free instruments like treasury bills. As Sharpe ratio is based on standard deviation which in turn is a measure of total risk inherent in an investment, Sharpe ratio indicates the degree of returns generated by an investment after taking into account all kinds of risks. It is the most useful ratio to determine the performance of a fund and you, as an investor, need to know its importance.
5.8 Capture Ratio
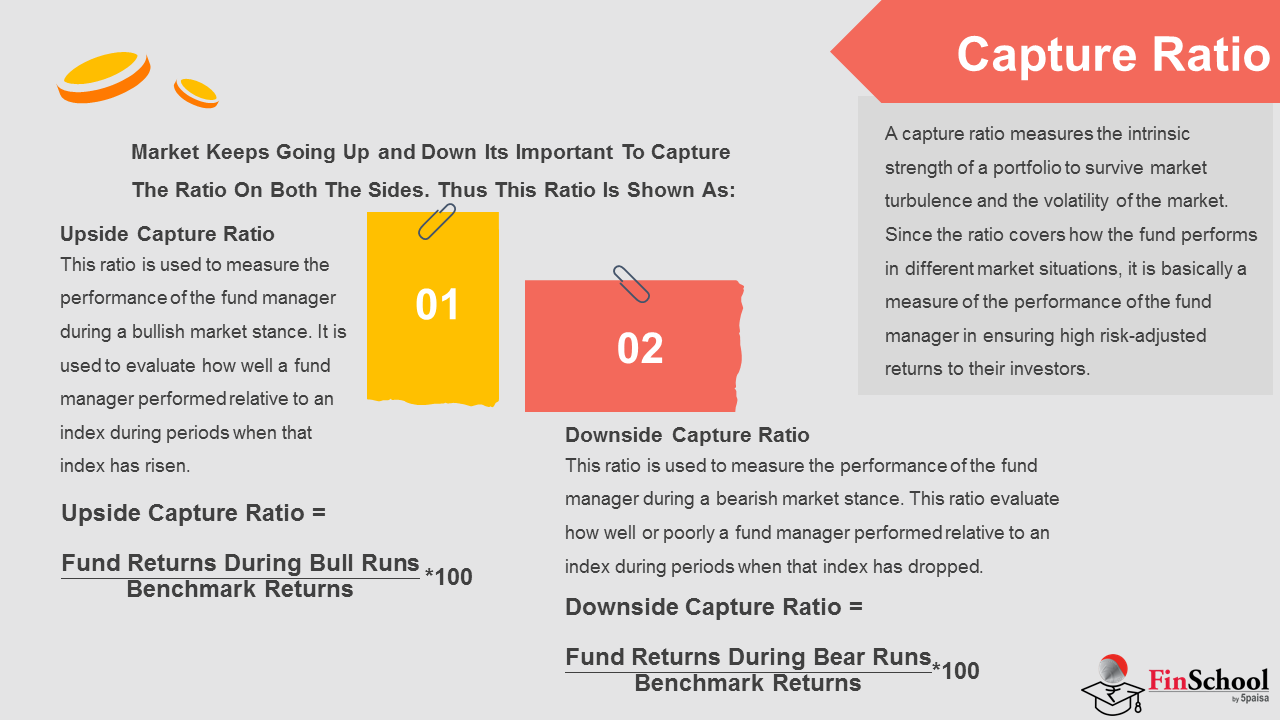
A capture ratio measures the intrinsic strength of a portfolio to survive market turbulence and the volatility of the market. Since the ratio covers how the fund performs in different market situations, it is basically a measure of the performance of the fund manager in ensuring high risk-adjusted returns to their investors.
It is expressed in percentage and reflects whether the mutual fund has underperformed or outperformed a benchmark index such as Nifty, Sensex, etc., during the market highs and lows. It is generally calculated for a period of 1, 3, or even 5 and 10 years.
Now since the market keeps going up and down its important to capture the ratio on both the sides. Thus this ratio is shown as:
Upside Capture Ratio
This ratio is used to measure the performance of the fund manager during a bullish market stance. It is used to evaluate how well a fund manager performed relative to an index during periods when that index has risen. It is calculated by dividing the fund's returns by the returns of the index during the up-market, and multiplying that factor by 100 [(Fund's Return/Index Return) x 100]. Upside capture ratios for funds are calculated by taking the fund's monthly/annual return during months/years when the benchmark had a positive return and dividing it by the benchmark return during that same period.
So, a fund manager who has an up-market ratio of more than 100 has outperformed the index during the up-market. For instance, a fund manager with an up-market capture ratio of 125 indicates that the manager outperformed the market by 25% during the specified period.
Upside Capture Ratio = (Fund returns during bull runs/Benchmark Returns)*100
Downside Capture Ratio
This ratio is used to measure the performance of the fund manager during a bearish market stance. This ratio evaluate how well or poorly a fund manager performed relative to an index during periods when that index has dropped. The ratio is calculated by dividing the fund's returns by the returns of the index during the down-market and multiplying that factor by 100 [(Fund's Return/Index Return) x 100].
Downside Capture Ratio = (Fund returns during bear runs/Benchmark Returns)*100
A downside capture ratio of less than 100 indicates that a fund has lost less than its benchmark during the periods when the benchmark has been in the red. If a fund manager has a down-market capture ratio of 82%, which indicates that it captured only 82% of its benchmark's negative performance during market down ward timings. Investors should note that these ratios are calculated and exhibited in the fact sheet of the mutual funds. Basically, it brings out the attitude of the fund manager towards risk and his capacity to provide higher risk adjusted returns.
Here is an example:
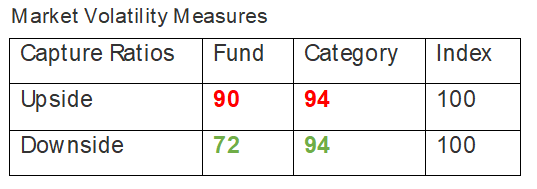
This is the capture ratio of Axis blue chip fund on a 3-year basis. We have taken this from Morningstar India website.
The fund has an upside capture ratio of 90, which implies that the fund has managed to capture 90% of the Index's upmove.
Likewise, the downside capture ratio is 72, which means that the fund has captured 72% of the downside returns of the Index.
All you need to remember is that that the upside capture ratio conveys the extent to which the fund captures all the positive returns of its benchmark. The downside capture ratio indicates the extent to which the fund captures (or rather avoided) the negative returns of its benchmark.
So whats the ideal capture ratio of a mutual fund? Well, we would want the fund which captures 100% of the upside if not more. At the same time, we would want the downside capture ratio to be as low as possible.
A fund will either have a great upside or a great downside capture ratio, but not both. Like in the above case the upside is 90% and downside capture is 72%.
Also, it does not matter if you choose to analyse the upside or downside capture ratio; what matters is the consistency. Hence it is important to look at capture ratios across multiple years.
If you look at Axis blue chip the downside capture ratio on 3, 5, and 10 years are 72, 69, and 76 respectively. Thus there is consistency in downside capture ratio. Even the upside capture ratio of this fund on 3,5 & 10 years is 90, 91 and 92- which is also very consistent.
5.9 Treynor's Ratio
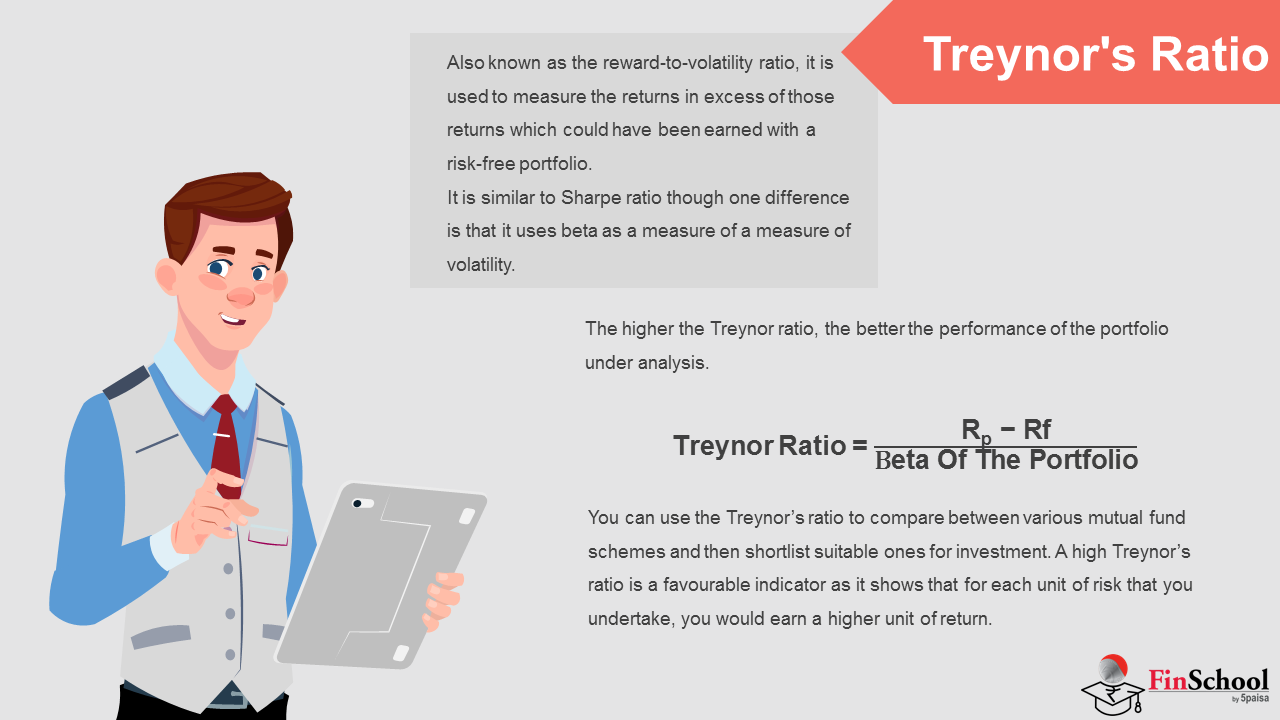
Also known as the reward-to-volatility ratio, it is used to measure the returns in excess of those returns which could have been earned with a risk-free portfolio.
It is similar to Sharpe ratio though one difference is that it uses beta as a measure of a measure of volatility. Beta, as we popularly know, is a measure of systematic risk of the portfolio and calculates to what extent the stock or the portfolio correlates with the index. Therefore a portfolio with a Beta > 1 is considered to be an aggressive portfolio whereas a portfolio with a Beta < 1 is considered to be a defensive portfolio. The market index (Nifty or Sensex) will always have a Beta of 1.
The higher the Treynor ratio, the better the performance of the portfolio under analysis.
Treynor Ratio = Rp - Rf /beta of the portfolio
You can use the Treynor's ratio to compare between various mutual fund schemes and then shortlist suitable ones for investment. A high Treynor's ratio is a favourable indicator as it shows that for each unit of risk that you undertake, you would earn a higher unit of return.
For example, say there are two mutual fund schemes. The first one has a Treynor ratio of 2 while the second one has a ratio of 3. This would mean that in the first fund if you undertake a risk of 1%, you stand to earn a return of 2%. On the other hand, in the second fund, if you take the risk of 1%, you stand to earn a return of 3%. So, for the same quantum of risk, the second fund offers a higher return potential and is, therefore, a better alternative.
When to apply Sharpe and when to apply Treynor ratio?
As mentioned earlier, the difference between Sharpe and Treynor is that the former uses the standard deviation as the denominator while the latter uses the Beta as denominator. While standard deviation measures the total risk of the portfolio, the Beta measures the systematic risk. For any business there are unsystematic risks that are specific to the company or industry. Then there are systematic risks like inflation, interest rates, government policy etc which apply to the entire economy. Therefore, Sharpe is a good measure where the portfolio is not properly diversified while Treynor is a better measure where the portfolios are well diversified.
