- Study
- Slides
- Videos
6.1 Introduction
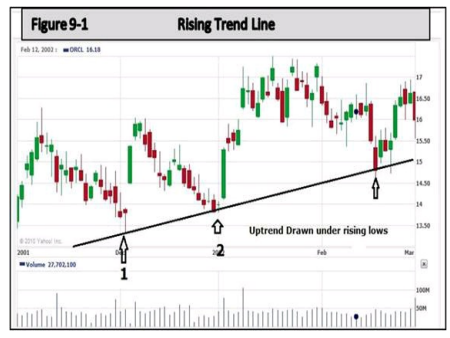
In the following chart we see a trend line drawn connecting the support levels where the stock has found support on 3 separate occasion.
Rising Trend Line

It only takes two points, or lows, to draw a trend line. Meaning, the trend line drawn in the above chart could have effectively been drawn after the stock had found support at point 1 and at point 2. However, while it only takes two points to draw a trend line, a third point is necessary to identify the line as a valid trend line.
6.2 How Does Trend Line Help
By drawing a trend line connecting points 1 and 2, we can then extend the trend line to the ‘infinite.’ Understand? As we learned from the Dow Theory, once a trend is started it continues. Yes, it does until something happens and causes the stock to change its direction and start a new trend.
So by looking at the above chart we see that the trend line starting at support point 1, and extended past (support) point 2 gives us a good idea as to where the stock might find support during any pullbacks in price. And as the chart clearly shows, that is what happened when the stock eventually traded higher and pulled back to find support right along the trend line.
The idea here, as you can see, is that this trend line is extended and continues to follow the stock.
This trend line creates buy (entry) points to purchase the stock. This is a great tool to use when considering trading or investing in a stock and looking for a place to enter. An advancing stock will pull back and usually find support very close to the trend line. That becomes a good entry point for a couple of reasons:
1) The trend line itself serves are minor support.
2) The stock has pulled back from a high and as it reaches the trend line, it is normally not that far from the previous low. This allows you to enter a position and place a stop loss just under the previous low. This limits any possible loss in case the stock turns and trades lower instead of advancing as you anticipate.
6.3 Interpretation of Trendline
As a rule, the longer a trend line has been in effect and the more times it has been tested, the more significant it becomes. The violation of a trend line is often the best warning of a change in trend. In other words, if the stock falls through the trend line, you should pay attention, it is important.
This can be an invaluable tool for the long-term investor. The Primary Trend of the market can be easily tracked along with the trend of any particular investments. Thus, the astute investor would be warned if the general market trend changed. Thus, a re-balance of the portfolio might be in order. Possibly even sell some holdings to prevent losses and lock in the gains.
Since we know that once a trend is established, the general movement continues in the direction of that trend, it makes little sense to continue to hold on to mounting losses once a trend has been broken.
Long-term investor is best in this explanation because many traders are quick to exit a position. But long-term investors are more apt to hold on. Problem is, one never knows where the bottom is. It could be a 50% or 60% loss or even more. So it is always better to be safe than sorry. Lock in the gains and watch for a support level to be reached.
A trend line also gives us a great idea as to where a stock should fall to, or pullback to, when looking to buy. In the above chart, if you were looking to invest in that stock, you could simply draw a trend line and wait for the stock price to pull back to the trend line to buy. That way you would not be buying after an advance and then suffer the loss during a pullback. Instead, you would be buying at the ‘low.
6.4 Channel Lines
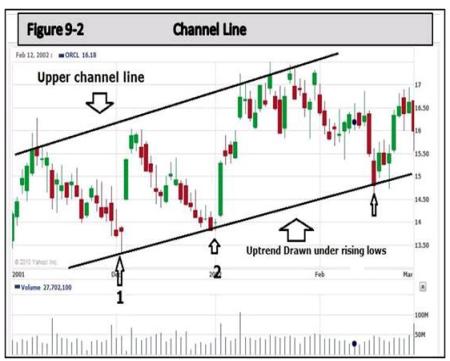
Channel lines are straight lines that are drawn parallel to basic trend lines. A rising channel line would be drawn above the price action and parallel to the basic trend line (which is below the price action) connecting the “highs” that the stock has reached.
In the following chart you can see a channel line drawn connecting the highs and is parallel to the trend line drawn below connecting the lows

Overall markets and stocks often trend within a channel. When this is the case, the chartist can use that knowledge to great advantage by knowing in advance where support and resistance are likely to be found.
As a trader, what if you purchased this stock as it found support the second time? You could then draw the trend and channel lines. Once it advanced to the upper channel line, you would know it may be time for a pullback. You could take your profit and wait for another opportunity to enter at a lower price.
You can see that the channel line tells us where the next ‘higher high’ should be found before the stock trades up to it.

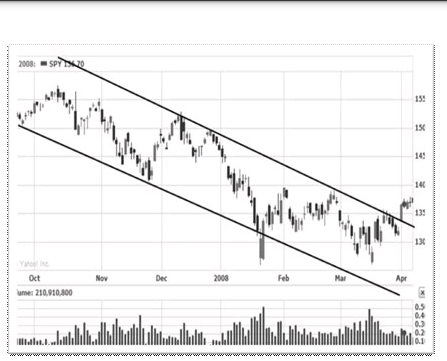
The above stock traded in a channel during the decline. By drawing the trend and channel lines, one would know where the stock price was likely headed if it continued to decline. You would also be alerted when it broke out of the channel, as it did on the right side of the chart after finding support. At that point, a new trend began.
6.5 How Does Channel Line Help?
This is all about entry and exit points. A short-term trader can take advantage of this information to exit at the highs and re-enter at the lows. A Day Trader might even exit a long position (sell) at the high and then go short (sell short) at the high to grab a quick profit on the pullback. Although ‘Shorting’ a strong stock in an uptrend would certainly not be advisable, but shorting a stock in a downtrend when it reaches the highs of a downward sloping channel line can be a very good entry point for a short sale.
A long term investor can use this information to help find good entry points as well. Following a trend can alert the investor that the stock has reached support and it is time to buy. Trends also help prevent buying at the wrong time. For instance, the more cautious investor may wait until the stock has broken out of the upper channel line during a move to the upside. This would be another confirmation that support had truly been found and the trend had changed.
6.6 Example

A long-term investor holding a stock sees that the stock has broken a trend line and closed lower. This information can, and should be used as an alert that the trend may be changing.
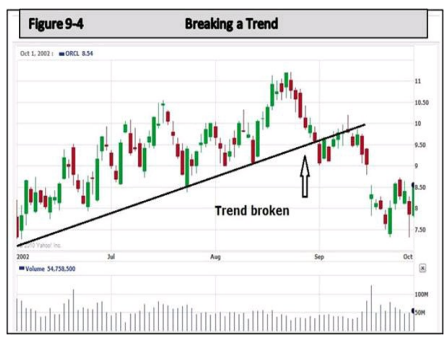
The above chart shows how a trend can be broken. Once a trend is broken, a new trend begins. In the above case it appears obvious the new trend is to the downside.
Even if this investor has already held this stock for a long period of time, why allow a profit to turn into a loss? When the above stock broke the trend line at 9.50 per share, there is no way of knowing, and certainly no guarantee that support will be found, ever. This information is highly valuable in the decision making process. The long-term investor sees a potential problem, and sets an alert, or a Stop Loss. Thus protecting any accumulated profit and preventing any loss.
On the other hand, a trader, or short-term investor, sees the same decline and makes decisions accordingly; possibly even shorting the stock at the high before the decline started or once the trend has been broken. In the above case, a trader using a trend line would recognize the stock fell through the trend line and then traded back up but could not make a higher high, or even close above the old trend. In other words, that would be a great shorting opportunity, selling the first lower high.

