- Study
- Slides
- Videos
9.1 The Spike Top
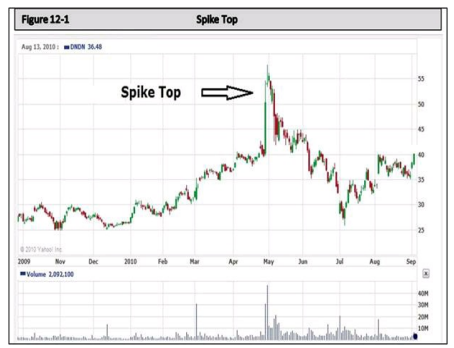
The spike top (also called a V-reversal) pictures a sudden change in trend.

What distinguishes the spike from the other reversal patterns is the absence of a transition period, which is sideways price action on the chart constituting topping or bottoming activity. This type of pattern marks a dramatic change in trend with little or no warning.
It is certainly not something you want to buy into. When you see one of these forming as the price increases dramatically, it’s not the time to buy. If you own the stock, it’s generally the time to sell! In the above chart, you can see the gradual, healthy advance from February to May, and then a sudden advance of 15.00 per share in the stock price, only to return to the trading range and then decline further.
There are several things that can cause this to happen. Many times you will never know the underlying cause. It could be a short squeeze or any number of things. That’s really not important. What’s important is what you do when it occurs.
-
If you own the stock – sell on the way up!
-
If you don’t own the stock – stay away from it!
When a stock is running up, take your profit. Don’t try to guess where the top may be, because the chances of you guessing it right are slim and none. Another thing to consider is this. If you own the stock and actually hold it through a spike top or bottom, it is usually wise to exit at the earliest opportunity. This is because the stock has now shown it has the tendency to react this way, and eventually you will get caught on the bad side of a reaction and it will cost you dearly. Sure, it’s nice to see a dramatic increase in price, but the next time may be a drastic drop instead.
9.2 The Spike Bottom
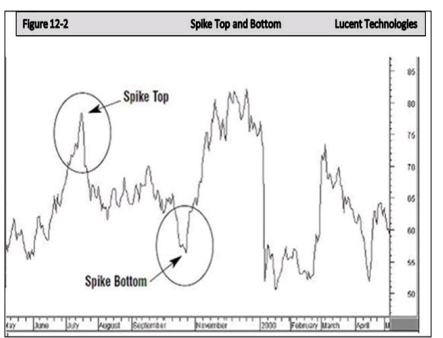
 You can see that the stock price has returned to the 60 trading range after the Spike Top. Then suddenly the price takes a dive. What causes this?
If you look closely, the stock had some support around $64 per share. Most traders and investors will place a Stop Loss just under a known support level in the event the stock breaks below support. This is very wise, and is something you should always do. A likely scenario in the above chart is the stock price fell below the 64 area where many had thought would be support. As the price declined below the anticipated support, the Stop Loss orders began automatically selling.
As the stop loss orders are filled, the price continues to decline. Short Sellers see this, and immediately sell the stock short to capture a quick profit on the decline. This creates even more decline, and more stop loss orders are executed, thus causing further, and rapid, decline in the price. But then a sudden reversal begins when the stock price reaches a level that many perceive to be a bargain for the stock, and they start buying.
Once the stock price has found a bottom, then demand overtakes supply, and the reversal is in place. This is almost the same scenario as the Spike Top. The Short Sellers must buy to cover their positions and capture their profit, and when they do, their buying once again causes the price advance. At the same time, while the short sellers are buying, other investors who believe the stock is oversold are buying and the rapid price increase moves the price back to the area of the trading range.
The Spike Bottom is also a problem if you own the stock. Mainly, because the drop in price will occur so rapidly that you won’t have the opportunity to get out. However, you should always have a stop loss in place to protect you from losses in the event something like this happened. But if you were caught holding the stock, you would most likely decide to sit and wait for the price to return somewhere close to normal, and then decide whether to close the position or not.
9.3 The Saucer
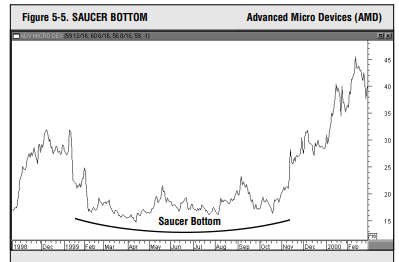
The saucer, in contrast to spike, reveals an unusually slow shift in trend. Most often seen at bottoms, the saucer pattern represents a slow and more gradual change in trend from down to up.

Looking at the chart you see little price movement during the formation of the Saucer. For almost a few months the stock stays in the 15-20 trading range with very little variation in price. Notice two peaks during this time period. It looks like it tried to muster up the energy to advance, but simply didn’t have the momentum to do it. Owning a stock like this will put you to sleep.
However, this is a perfect type setup to put on your stock alerts. For instance: If you are perusing stock charts and see a stock in this formation. You might want to set an alert to notify you if the stock ‘breaks out.’
In this particular case, an alert could have been set for 18 or 20. Just above the last known resistance. Then if the stock hit that price you would be alerted that a possible break out was happening. At that point you could wait for confirmation, check the volume on the breakout, and then buy. The confirmation would be a close above those peaks in the center of the rounded bottom. Therefore a close in the 20 range on good volume would confirm that the break out was in place.

