- Study
- Slides
- Videos
10.1 What is Relative valuation?
While discounted cash flow analysis forms the foundation of valuation it is, undoubtedly, a challenging and time-consuming process involving many highly subjective assumptions. Small adjustments to the long-run growth prospects of a company or the required return on equity can result in large changes in the valuation. The magnitude and timing of the cash flows themselves can also be extremely difficult to predict. And even if the analyst is highly confident of the estimations used in his analysis, what should he do if he arrives at a “correct” price for the company stock of Rs.250 per share and then observes that the stock is currently trading in the market at Rs.400? Is it likely that everyone else in the market is mispricing the stock and only he knows the correct price? And even if this were the case-is there any reason the market must move to the “right” price? If it is wrong now, could it get “wronger”? While extraordinarily important for establishing the conceptual foundation for valuation in general, because of the many challenges it presents, it is rare to find anyone other than a research analyst, investment banker, or particularly diligent proprietary trader actually producing a discounted cash flow valuation.
In practice, the majority of actual valuation discussions center on the question of relative valuation. In this approach, analyst estimates the value of a common share as the multiple of some measure, such as earnings per share (EPS) or revenue per share. The multiple is determined based on price and the relevant measure for publicly traded, comparable equity securities. The key assumption of the relative valuation approach is that common shares of companies with similar risk and return characteristics should have similar values. Relative valuation relies on the use of price multiples of comparable, publicly traded companies or an industry average.
One multiple commonly used in relative valuation is the price-to-earnings ratio (P/E), which is the ratio of a company’s stock price to its EPS. For instance, a publicly traded company that generates annual earnings per share of Rs100 and is trading at Rs.1200 per share has a P/E (or price-to-earnings multiple) of 12.
10.2 Application of Relative Valuation Method
-
An investor is estimating the value of the common stock of Crompton Consumer, a Indian consumer durable company, on a per share basis.
-
Analysts estimate that Crompton will generate EPS of Rs.12 next year.
The investor gathers information on three competing consumer durable players: Havells India, Voltas & Whirlpool. The investor calculates the P/E (shown in the fourth column) for each of the three companies.

The average P/E of three companies is (52+52+36)/3= 47x
Thus investor estimates the fair value of Crompton common stock, on a per share basis should be not more than is Rs. 564(= 12-47).
10.3 Multiples Used
To assess the relative valuations of different companies, analysts frequently use financial ratios called price multiples. These compare the market price of the stock to the value of different fundamental metrics such as earnings, book value, or sales.
A-Price-to-earnings (PE):
The most commonly used price multiple is the price-to-earnings ratio (PE ratio), which is the ratio of the market price of the stock to the earnings per share generated by the company.
PE ratio = Market price per common share/Earnings per common share
The PE ratio can be thought of as the price paid per units of earnings-that is, a PE ratio of 15× indicates that purchasers of the stock are paying Rs15 for every Rs.1 of earnings produced per share. PE ratios will vary greatly between companies and industries depending on risk, growth prospects, and other factors..
It is important to specify whether the PE ratio is calculated on a forward or historical basis. A historical PE compares the previous period’s earnings (either the annualized one-quarter earnings or the sum of the previous four quarters) to the current market price, while a forward PE compares the expected earnings in the next period (or year) to the current price.
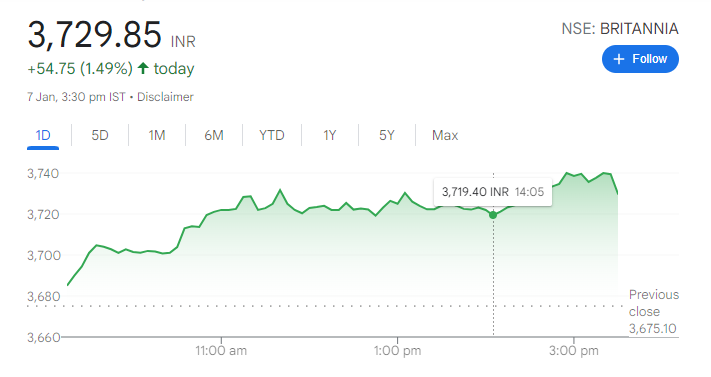
For Example: Incase of Britannia- if the current Price Rs.3729 and current EPS is 65- then PE ratio on historical basis would be 3729/65 i.e 57x. Analyst estimate that next year EPS of Britannia industries would be Rs.79- thus 1 year forward P/E ratio of Britannia would be 3729/79= 47x.
Thus, If earnings are expected to increase, then the forward PE will be lower than the historical. While forward earnings are generally of more interest, they implicitly include the analyst’s expectations of future growth and are therefore more subjective than historical earnings, which can be computed objectively from a firm’s financial disclosures.
While in general, lower values indicate a better value (earnings that can be acquired more cheaply), in practice, the PE ratio at which a given stock trades is a function of many factors. A stock with a historical PE ratio of 20* but whose earnings are expected to double would be “cheap” compared with a company with a PE of 12* whose earnings are not expected to grow at all. The risk associated with the actual production of future earnings will also affect the PE as more volatile or uncertain earnings streams command a lower PE (higher earnings yield) than more stable earnings.
B-PEG Ratio- Price Earnings Growth
One way to more explicitly factor a company’s expected growth rate into the historical PE ratio is to calculate the PEG ratio, which is the PE ratio divided by the expected growth rate.
PEG ratio = PE Expected/ % annual growth
PEG ratios below two are generally considered attractive. (The expected annual growth is expressed as an integer rather than a percentage (i.e., 20 instead of 20 percent). The combination of the historical PE and forward-looking PEG ratio gives a more complete picture of the stock’s price based on both the present and future earnings generation ability (though adjustments for risk are still necessary)
Incase of Britannia- PEG Ratio= Expected PE/ % annual growth
Now, expected PE is 46 and the growth rate is (earnings increasing to 79 from 65- % growth is 22%
So PEG= 46/22= 2.09
C- Enterprise Value to EBITDA Ratio
A limitation of the PE ratio is that it only values the equity portion of a company. An alternative is the ratio of the enterprise value (EV) of the firm to its EBITDA.
The enterprise value is the sum of the market values of all existing sources of capital: common equity, preferred equity, debt, and minority interest, less cash, and cash equivalents.
EBIDTA= This stands for Earnings Before Interest Taxes Depreciation and Amortization. It often used in valuation as a proxy for cashflow, although for many industries it is not a useful metric.
The EV/EBITDA multiple answers the question of, “For each rupee of EBITDA generated by a company, how much are investors currently willing to pay?”
At their simplest, the two metrics can be calculated using the following formulas:
-
Enterprise Value (EV) = Equity Value +Debt- Cash & Cash Equivalents
-
EBITDA =EBIT+Depreciation & Amortisation
One of the advantages of EBITDA is that it is not affected by financing and accounting decisions. The enterprise multiple looks at a company in the same way as a potential acquirer would, and therefore, the debt is included. A company with a low P/E ratio compared to similar companies in the same industry may look cheap, but the company may have a large debt burden that is not reflected in the P/E ratio. Instead this in reflected in a high enterprise multiple. For most companies, the EV/EBDITA is lower than the P/E ratio.
A high EV/EBITDA multiple implies that the company is potentially overvalued, with the reverse being true for a low EV/EBITDA multiple. Generally, the lower the EV-to-EBITDA ratio, the more attractive the company may be as a potential investment. A low EV-to-EBITDA ratio could signal that a stock is potentially undervalued.
Example, Lets calculate the current EV/EBIDTA for Britannia Industries.
EV= Mcap+ Debt-Cash & cash equivalents

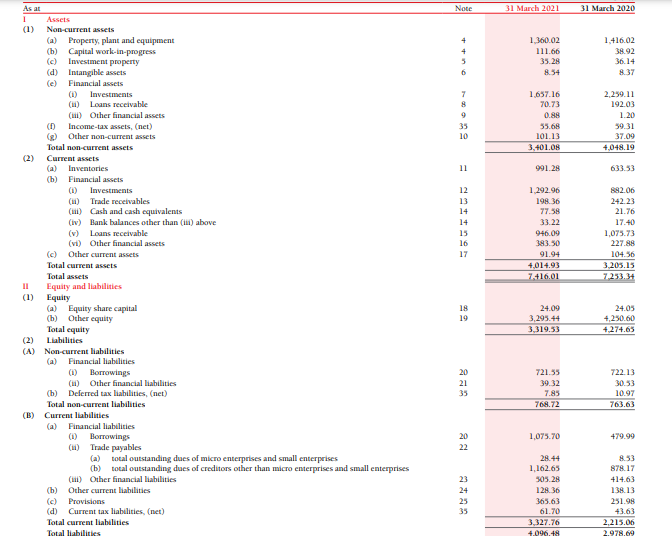
Balance sheet of Britannia

Mcap of Britannia Industries= Rs.89920crs
Debt on the balance sheet = 721.55+1075.70= Rs.1797crs
Cash on the balance sheet=Rs. 77.6crs
EV= 89920+1797-77.6= 88045crs
Now lets look at EBIDTA,
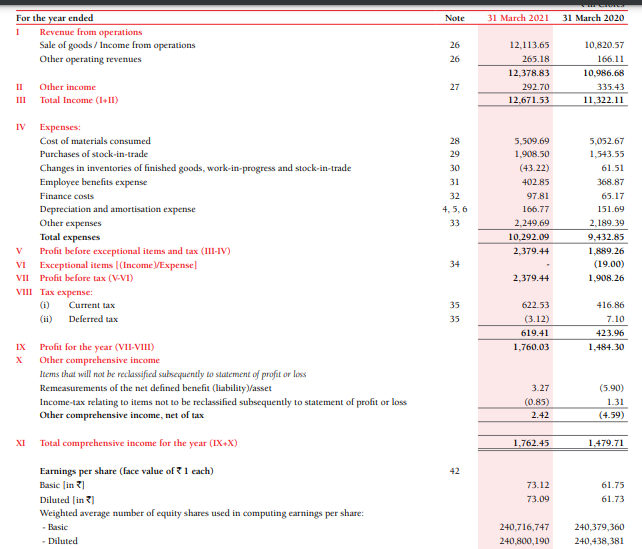
EBIDTA= Profits before exception items & Tax+ Finance Cost+ Depreciation expense- Other income
= 2379.44+97.81+166.77-292.70
= Rs.2351crs

Thus,
EV/EBIDTA= 88045/2351= 37.45x
D-Price-to-book (PB) Value Ratio.
This ratio has been explained in detail in the previous chapter. It is an alternative measure of the value inherent in the stock price is the price-to-book-value-ratio (PB).
PB ratio = Market price per common share/ Book value per common share
The book value ignores the earnings potential of the company and focuses primarily on what has already been done—the retained earnings and paid-in capital that belongs to the common equity holders.
E-Price/Sales Ratio
Within a given industry, where products and margins are relatively homogeneous, it can be useful to compare stocks based on a price-to-sales-ratio (PS).
PS ratio = Market price per common share/ Sales per common share
Dividing the PS ratio by the Net profit margin = Net income/Sales gives the PE ratio. This separation of the PE ratio into the combination of sales and margins can be useful in situations where margins are an exogenous factor (e.g., sectors highly sensitive to commodity prices) or as a means of isolating the sales-producing ability of the company from the efficiency of its production.
Detailed explanation of this ratio is available in the previous chapter.
F-Price-to-cash-flow (PCF):
A final measure of profitability uses the all important free cash flow. The PCF ratio compares the stock price to the per-share operating cash flow.
PCF ratio = Market price per common share/ Free cash flow per common share
The inverse of the PCF ratio is the free cash flow yield, which measures the return on an investment in the stock in terms of free cash flow generation.
10.4 Why is relative valuation so widely used?
-
A valuation based upon a multiple and comparable firms can be completed with far fewer assumptions and far more quickly than a discounted cash flow valuation.
-
A relative valuation is simpler to understand and easier to present to clients and customers than a discounted cash flow valuation.
-
A relative valuation is much more likely to reflect the current mood of the market, since it is an attempt to measure relative and not intrinsic value.
Thus, in a market where all internet stocks see their prices bid up, relative valuation is likely to yield higher values for these stocks than discounted cash flow valuations. In fact, relative valuations will generally yield values that are closer to the market price than discounted cash flow valuations. This is particularly important for those whose job it is to make judgments on relative value, and who are themselves judged on a relative basis. Consider, for instance, managers of technology mutual funds. These managers will be judged based upon how their funds do relative to other technology funds. Consequently, they will be rewarded if they pick technology stocks that are under valued relative to other technology stocks, even if the entire sector is over valued.
10.5 Types of Relative Valuation Models
There are two common types of relative valuation models: comparable company analysis and precedent transactions analysis.
Comparable Company Analysis
Comparable company analysis, or “Comps” for short, is commonly used to value firms by comparing them to publicly traded companies with similar business operations. An analyst will compare the current share price a public company relative to some metric such as its earnings to derive a P/E ratio. It will then use that ratio to value the company it is trying to determine the worth of.
The advantages of Comparables are that they are always current, and it’s easy to find financial information on public companies.
Precedent Transaction Analysis
Precedent transactions, or “Precedents” for short, is a method of valuing companies by looking at historical transactions where entire companies were bought or sold (mergers and acquisitions). These transactions show what an investor was willing to pay for the entire company. Precedents also use ratios, such as EV/EBTIDA.
Precedents are useful for valuing an entire business (including a takeover premium or control premium), but can quickly become out of date, and the information can be difficult to find.
10.6 Advantages of Relative Valuation
Whether conducting a comparable company analysis or precedent transaction analysis, both types of relative valuation approaches present similar benefits to investors that are attempting to value a company. Some of the key advantages include:
-
Ability to measure a company’s performance in relation to the wider market and its major competitors
-
Capability to apply various valuation ratios that can output a complete picture on the true value of a security within a given industry (transcending stock price in the case of public companies)
-
Power to value a company without accessing proprietary data (comparing the value to public companies or previous transactions within private markets)
-
Can be conducted through simple observation techniques by the wider public and brokers (when considering the stock market)
10.7 Disadvantages of Relative Valuation
There are also limitations to relative valuation processes with some contending that it is impossible to get a clear picture of a company’s value without analysing its intrinsic financials.
Other disadvantages include:
-
They are backward looking and historical, which is not always an indication for future performance
-
Can be based only on external observations that may be misleading
-
Companies can potentially manipulate certain ratios to appear to be performing better than they are
-
There is a potential to over-value some industries which could result in a bubble

